Summary
INDUSTRIAL PARK INFRASTRUCTURE DEVELOPMENT REPORT - CURRENT SITUATION AND DEVELOPMENT PROSPECT 2022
In the second quarter of 2022, the country’s GDP growth is estimated to increase 7.7% compared to Q2/2021 according to the calculations of the General Statistics Office of Vietnam. This is the highest Q2 growth rate in 10 years. In the context that the world situation is still complicated with inflation shock in many countries at the beginning of 2022 and Vietnam is in the first stage of growth after the pandemic, this growth finger is really impressive, showing that the economy is getting thriving. In which, more than 39% contributed to the increase from the Industry and Construction.
In the first 6 months of 2022, IIP in Vietnam increases about 9%, of which the manufacturing industry increases the most by about 10%. The total of the IIP and the manufacturing industry in 2022 are lower than the growth rate of the same period in 2021 and only higher than the rate of 2020, almost equal to the rate of the same period in 2018. Despite maintaining the growth rate from appearing the pandemic, the world’s price fluctuations, rare materials, especially the price of materials increases highly due to Russia-Ukcraine war and China’s Zero-covid policy has restrained the growth of product output.
Industrial land for rent is the most popular and oldest developed form of industrial real estate in Industrial Parks in Vietnam. Based on a survey of 258 active industrial parks, we found that 33% of the industrial land banks are leased for less than 50 USD/m2/lease period, and 26% of industrial parks with land leasing prices from 51-70 USD/m2/lease period. Especially in 2021, there have appeared a number of industrial parks with land leasing prices of more than 200 USD/m2/lease period, mainly in the South, although it only accounts for 3%, it also shows that the land rent has increased especially in the Southern Region in the past year.
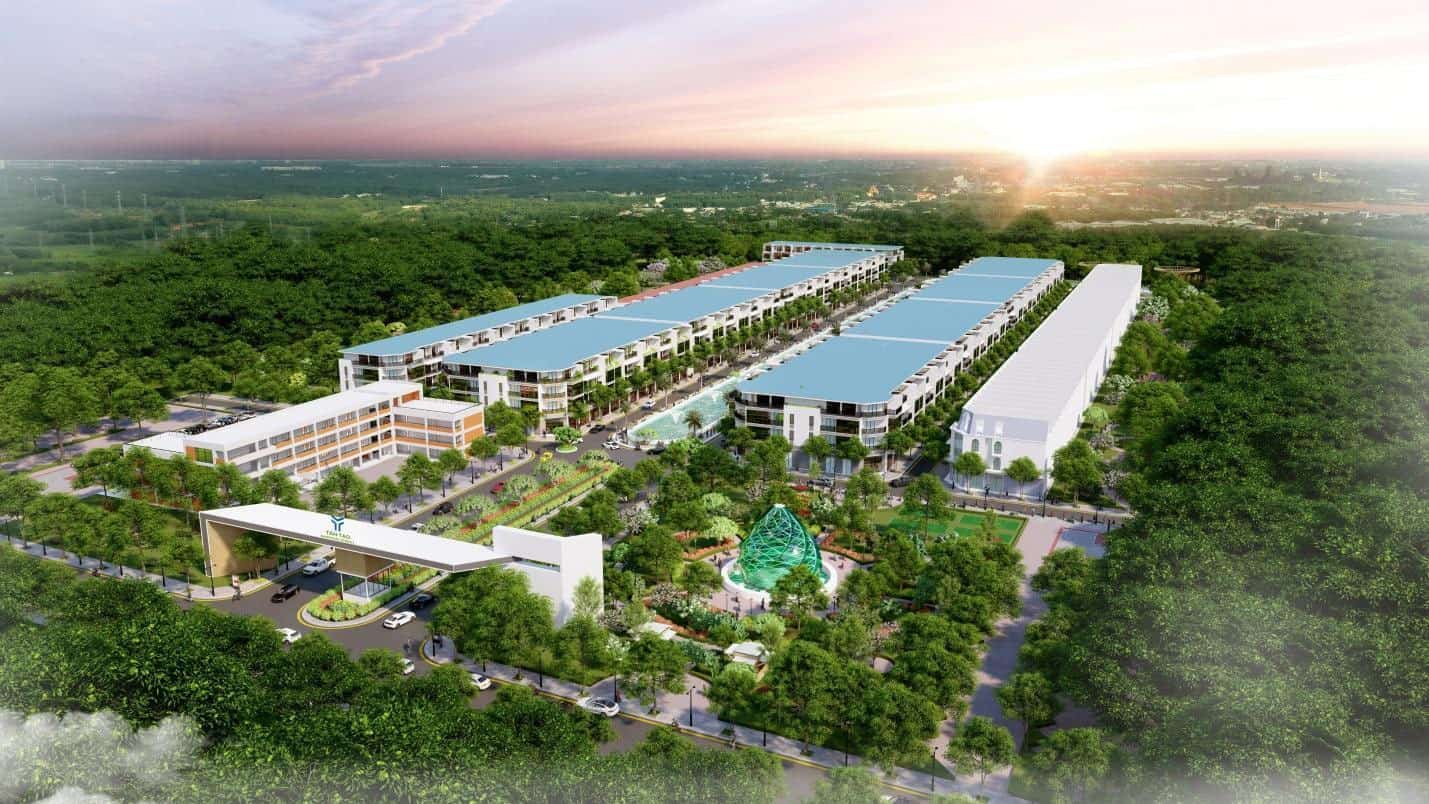
Nowadays, ready-built factories are very attractive and have an increasing scale of investment capital but mainly towards the projects with a factory scale that is not too large and complicated as well as requires high technology. High-tech ready-built factories are tending to increase in recent years because the State has supporting policies, creating momentum for the development of high-tech industrial parks. However, this ratio is not much, and the fact that currently, high-tech industrial parks in Vietnam have not fully developed yet so they have not attracted many investors. Currently, Vietnam still mainly concentrates on the heavy industry with little high technology requirement so this type of real estate has not increased too fast. The increasing need of investors as well as the focus on the quality of factories of industrial park investors currently contributes to increasing more choices for the investors when referring to the industrial park market in Vietnam.
The new industrial parks in 2022
According to our data, in the first 6 months of 2022, about 27 new industrial parks are added to the country. In which, the Northern region is added the most with 15 parks, the Southern region is 7 parks and in the Central, there are 5 parks. In both quantity and planning areas, the new industrial parks in the North account for the majority, showing that the supply of provinces in the North is ready to take over new investment capital in the next years.
Status of some investment projects for the industrial park
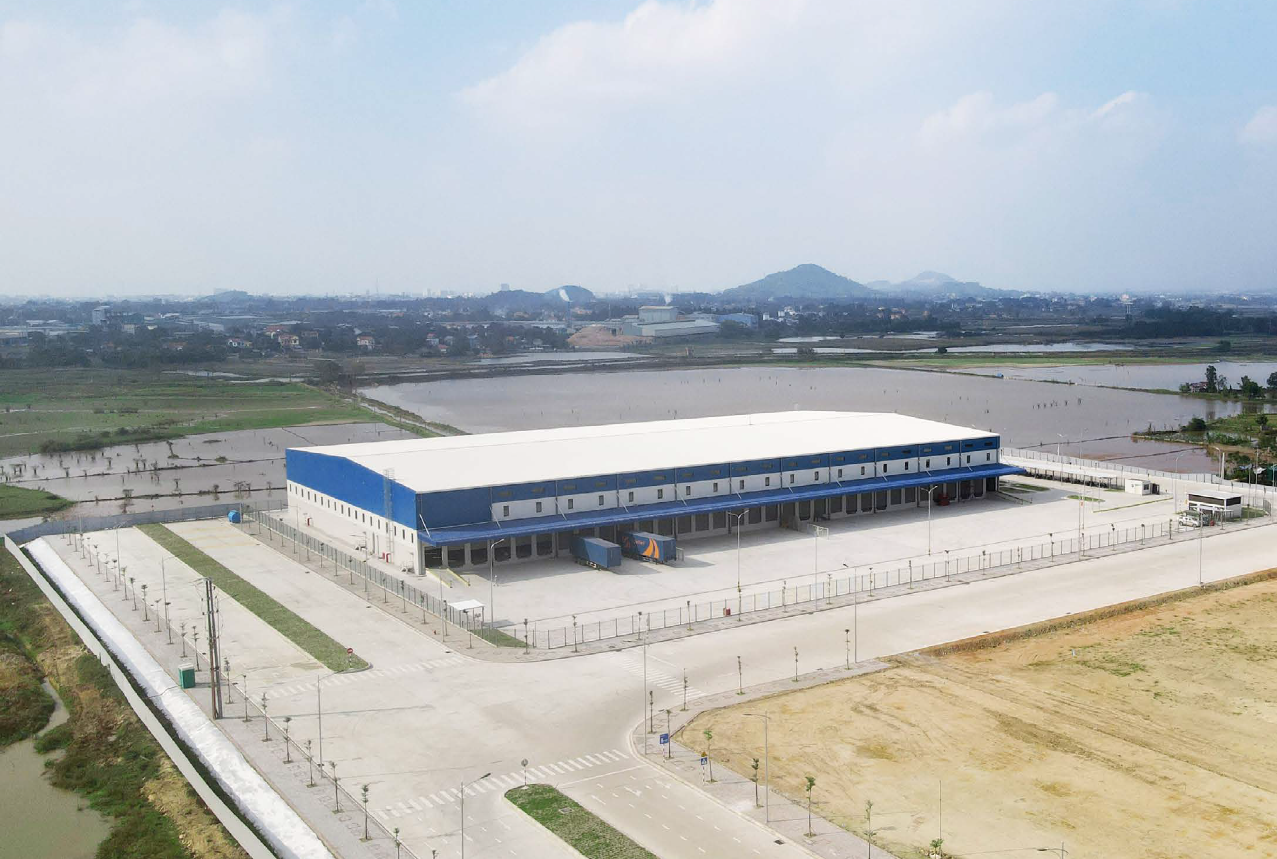
Real estate of newly registered FDI projects in 2021 and the first 6 months of 2022 was very developed. Whereby, we can see that the trend of warehouse rental was raising both sides in a number of projects and registered investment capital. Especially in 2022, this trend is more and more clearly expressed when the number of warehouse rentals in the first quarter of 2022 raised 132% than the fourth quarter of 2021 and raised 193% over the same period of 2021. In the second quarter of 2022, the number of warehouse rental projects also raised 100% over the same period of 2021. The scale of investment capital of warehouse rental projects was also highly raised when the total registered investment of newly registered FDI projects in 6 months of 2022 up to 93% over the same period of 2021. Meanwhile, land lease projects were, on the contrary, both numbers of projects and investment capital scale were trending decreased.
In the first 6 months of 2022, we concluded that the textile industry was the industry that had many newly registered FDI projects. After that was: Electronic, metal, logistic, footwear,v..v. As we can see, textile was the industry that got much FDI capital in all 3 domains. Especially in central and southern, this was the industry that attract the most projects. And in northern, electronic and logistic was still top industry. This is completely matched with industrial park infrastructure in 3 domains. In Southern, a long time ago, textile was very developing because this was the convergence of many big textile projects, moreover, IPs from southern had a good infrastructure and an abundant number of workers. In northern, factories and warehouse for the logistic industry was very focusing on investment. Moreover, Nothern had a lot of IPs that invested in high-tech infrastructure, import of special electronic materials from China had many advantages in terms of geographical location, and traffic infrastructure had been improved so that it can attract FDI inflows in the electronic industry.
Industrial Parks attract most newly registered FDI projects in the first 6 months of 2022
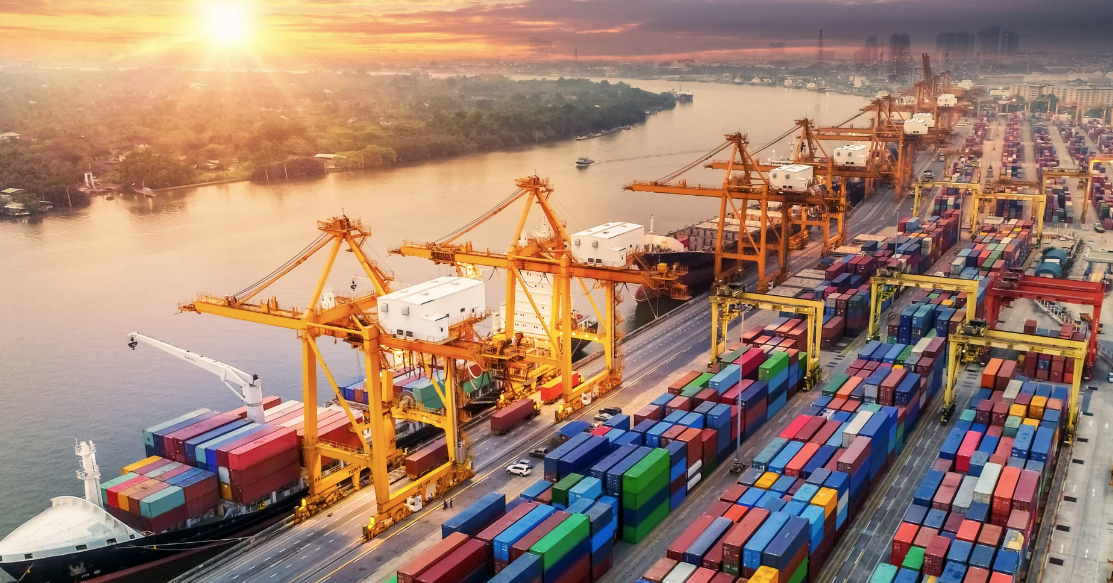
When analyzed about the top 10 IPs, we conclude that from the beginning of the year until now, the Industrial Parks selection trend of FDI investors was still leaning towards the location of IPs that are convenient in terms of geographical location. When 80% of every industry is adjacent to the route and more than 50% of them only less than 30km from the port/airport/highway.